The University of Hawaii Rainbow Warriors play their home games at a five hour offset from the East Coast. I don't begrudge them living in Paradise, but the peculiarity of the time zones means that ESPN often reports their games as happening the day after they were actually scheduled.
This annoyance I don't need.
Wednesday, November 18, 2015
Tuesday, November 17, 2015
Kind of Amazing
That's an animation of NBA movement data, which apparently you can get via a free API. Savvas Tjortjoglou goes into detail here. Who knows what sort of predictive model you could build exploiting this data. Thankfully the NCAA doesn't have anything of the sort, or I'd have to quit my day job.
Saturday, November 14, 2015
Really, ESPN?
With the first day's games done I fired up my ESPN score scraper to gather up the data and get the season started.
It crashed.
It seems like ESPN chose the first day of the season to roll out a new format (and URL scheme) for their basketball scoreboard page.
To be fair, I wrote my current (Python Scrapy-based) scraper with the help of Brandon Harris (*) and he warned me when I started down this road that ESPN was busy mucking up all their scoreboard pages. "Oh no," said I, "it looks fine, I'm sure they won't change it at the last second." So I have no one to blame but myself.
(*) And by help I mean he basically gave me working code.
ESPN went all Web 3.0 in their page redesign, which means that rather than send a web page, they send a bunch of Javascript and raw data and make your web browser build the page. (Which probably saves them millions of dollars a year in server costs, so who can blame them?) This breaks the whole scraper paradigm, which is to Xpath through the HTML to find the bits you need. There's no HTML left to parse. The good news in this case is that ESPN was nice enough to include the entire URL I need in the data portion of the new format, so it is very easy to do a regular expression search and pull out the good parts. Otherwise you get into some kludgy solutions like using a headless web browser to execute the Javascript and build the actual HTML page. Or trying to find the mobile version of the page and hope that's more parseable.
I don't do anything much with the model until after a few weeks of games, so I have some time to fix my code. And I suppose that if you want to scrape data from the Web, you'd better be prepared to deal with change.
Friday, November 13, 2015
Improving Early Season Performance
(I hope you're enjoying the first evening of college basketball!)
In my previous posting, I looked at the performance of my predictor on a week-by-week basis throughout the season. This showed that performance was poor at the beginning of the season (when our knowledge about teams is most uncertain) and improved throughout the season (at least until play shifts to tournaments). Is there any way we can use this insight to improve performance?
One approach is to let the model try to correct for the week to week differences. To do this, the model needs to know the week of the season for each game. But it isn't sufficient to simply have a feature with the week value (e.g., WEEK_OF_SEASON=22) because most models (and linear regression in particular) will treat that feature as a continuous value and be unable to apply a specific correction for a specific week. The solution to this is to use "one hot encoding".
One hot encoding is applicable to any sort of categorical feature -- a feature with distinct values that represent different categories, such as week in the season, day of the week, etc. One hot encoding splits the categorical feature up into a number of new features, one for each possible value of the categorical feature. For example, DAY_OF_THE_WEEK would get split into 7 new features. For each example in our data set, the appropriate feature is set to 1 while all the other features are set to 0. For a game that took place on Tuesday, the new feature DAY_OF_THE_WEEK_2 would get set to 1 (assuming Sunday is Day Zero), and DAY_OF_THE_WEEK_0, DAY_OF_THE_WEEK_1, etc. would get set to 0.
Once we've hot encoded the WEEK_OF_SEASON the model can correct on a week-by-week basis. However, whatever correction the model applies will apply to every game that week, so this approach is only suitable to correct any overall bias for that week. If the error in the week is completely random, this approach won't help.
So is there a weekly bias (at least in my model)?
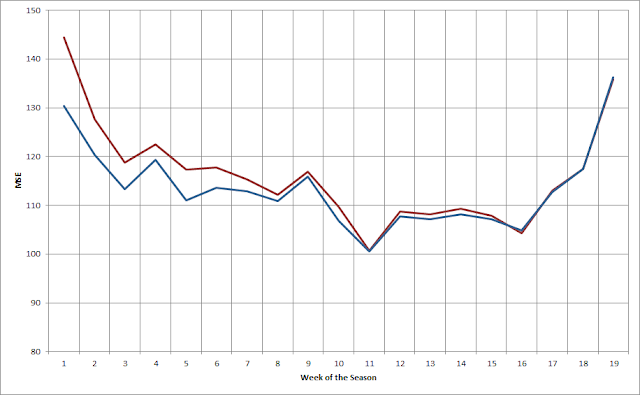
The following chart shows the Absolute Error for my model each week both before (red) and after (blue) applying this technique.

As you can see, in many weeks before applying the correction there's significant bias. Afterwards the bias is reduced to near zero. That's not surprising -- essentially what a linear regressor will do in this situation is set the new feature to be worth the negative of the mean bias, thus it will exactly cancel the bias.
Adding the hot-encoded WEEK_OF_SEASON eliminates weekly bias, but it doesn't eliminate more complex errors. A potentially better approach to reducing early season error is to add more reliable information about the strength of teams in the early season. But until teams play some games, how can we know how good they are? An obvious approach is to guess that they're about as good as they were the previous season. This isn't a perfect proxy -- after all, teams do get better or worse from season to season -- but there is a strong correlation between seasons, so it's generally a pretty good guess.
But there's a problem with just throwing data from the previous season into our model. We really only want the model to use the old data until the new data is better than the old data. It's fairly straightforward to figure out when that happens -- we run the model once on the old data and once on the new data, and look for where the new data starts to outperform the old data. But what's not easy is to stop using the old data in the model. You can't change the number of features in your training data halfway through building a model!
There are several ways you might address this problem. You could have two models, one that uses the old data up to the crossover point, and another only uses the new data after that point. You could use a weighted moving average, and start the year with the old data and gradually replace it with the new data. Or you could have both the old data and the new data in the model, but replace the old data with the new data once you hit the crossing point.
I've tried all of these approaches. Having two models is very cumbersome and creates a lot of workflow problems. The second is the most intellectually appealing, but I've never been able to get it to perform well. The third approach is simple and flexible, but has the drawback that after the crossing point the new data is in the model twice. Despite that drawback, this approach has worked the best for me.
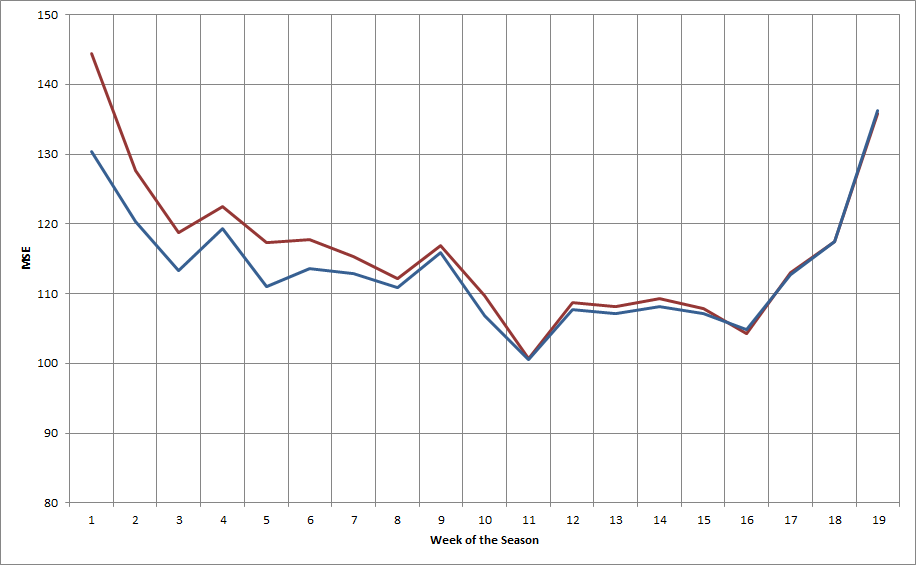
The plot below shows the mean squared error for the model both before (red) and after (blue) adding in data from the previous season.
As you would expect, this shows the most improvement early in the season -- quite dramatically in the first few weeks -- and tapers off after that. In this case, the cutoff is in the 12th week of the season. After that the impact of the old data is eliminated.
It's also interesting to look at how the old data impacts performance against the spread:

(In this graph, bigger is better.) In this case, the addition of the previous season's data helps our performance against the spread through about the first ten weeks (and nearly eliminates the anomalous performance in Week 5). Interestingly enough, this actually hurts performance slightly after Week 16.
Overall, accounting for week-by-week bias and using the previous season's data to improve early season predictions is an effective approach. It should be noted, though, that the overall improvement from these changes are modest: about 0.10 point in RMSE and less than 1% in WATS.
An interesting line of speculation is whether it is possible to easily improve the value of the previous season's data. For example, it's reasonable to expect that from year-to-year teams will tend to "regress to the mean". If that's true, regressing the previous year's data towards the mean might further improve performance.
In my previous posting, I looked at the performance of my predictor on a week-by-week basis throughout the season. This showed that performance was poor at the beginning of the season (when our knowledge about teams is most uncertain) and improved throughout the season (at least until play shifts to tournaments). Is there any way we can use this insight to improve performance?
One approach is to let the model try to correct for the week to week differences. To do this, the model needs to know the week of the season for each game. But it isn't sufficient to simply have a feature with the week value (e.g., WEEK_OF_SEASON=22) because most models (and linear regression in particular) will treat that feature as a continuous value and be unable to apply a specific correction for a specific week. The solution to this is to use "one hot encoding".
One hot encoding is applicable to any sort of categorical feature -- a feature with distinct values that represent different categories, such as week in the season, day of the week, etc. One hot encoding splits the categorical feature up into a number of new features, one for each possible value of the categorical feature. For example, DAY_OF_THE_WEEK would get split into 7 new features. For each example in our data set, the appropriate feature is set to 1 while all the other features are set to 0. For a game that took place on Tuesday, the new feature DAY_OF_THE_WEEK_2 would get set to 1 (assuming Sunday is Day Zero), and DAY_OF_THE_WEEK_0, DAY_OF_THE_WEEK_1, etc. would get set to 0.
Once we've hot encoded the WEEK_OF_SEASON the model can correct on a week-by-week basis. However, whatever correction the model applies will apply to every game that week, so this approach is only suitable to correct any overall bias for that week. If the error in the week is completely random, this approach won't help.
So is there a weekly bias (at least in my model)?
The following chart shows the Absolute Error for my model each week both before (red) and after (blue) applying this technique.

As you can see, in many weeks before applying the correction there's significant bias. Afterwards the bias is reduced to near zero. That's not surprising -- essentially what a linear regressor will do in this situation is set the new feature to be worth the negative of the mean bias, thus it will exactly cancel the bias.
Adding the hot-encoded WEEK_OF_SEASON eliminates weekly bias, but it doesn't eliminate more complex errors. A potentially better approach to reducing early season error is to add more reliable information about the strength of teams in the early season. But until teams play some games, how can we know how good they are? An obvious approach is to guess that they're about as good as they were the previous season. This isn't a perfect proxy -- after all, teams do get better or worse from season to season -- but there is a strong correlation between seasons, so it's generally a pretty good guess.
But there's a problem with just throwing data from the previous season into our model. We really only want the model to use the old data until the new data is better than the old data. It's fairly straightforward to figure out when that happens -- we run the model once on the old data and once on the new data, and look for where the new data starts to outperform the old data. But what's not easy is to stop using the old data in the model. You can't change the number of features in your training data halfway through building a model!
There are several ways you might address this problem. You could have two models, one that uses the old data up to the crossover point, and another only uses the new data after that point. You could use a weighted moving average, and start the year with the old data and gradually replace it with the new data. Or you could have both the old data and the new data in the model, but replace the old data with the new data once you hit the crossing point.
I've tried all of these approaches. Having two models is very cumbersome and creates a lot of workflow problems. The second is the most intellectually appealing, but I've never been able to get it to perform well. The third approach is simple and flexible, but has the drawback that after the crossing point the new data is in the model twice. Despite that drawback, this approach has worked the best for me.
The plot below shows the mean squared error for the model both before (red) and after (blue) adding in data from the previous season.
As you would expect, this shows the most improvement early in the season -- quite dramatically in the first few weeks -- and tapers off after that. In this case, the cutoff is in the 12th week of the season. After that the impact of the old data is eliminated.
It's also interesting to look at how the old data impacts performance against the spread:

(In this graph, bigger is better.) In this case, the addition of the previous season's data helps our performance against the spread through about the first ten weeks (and nearly eliminates the anomalous performance in Week 5). Interestingly enough, this actually hurts performance slightly after Week 16.
Overall, accounting for week-by-week bias and using the previous season's data to improve early season predictions is an effective approach. It should be noted, though, that the overall improvement from these changes are modest: about 0.10 point in RMSE and less than 1% in WATS.
An interesting line of speculation is whether it is possible to easily improve the value of the previous season's data. For example, it's reasonable to expect that from year-to-year teams will tend to "regress to the mean". If that's true, regressing the previous year's data towards the mean might further improve performance.
Friday, November 6, 2015
Performance By Week of Season
Python has some nice built-in plotting capabilities, so with a little work I was able to analyze the performance of my predictor by week of the season. This is what that looks like:
 The red dotted line is the predictor's average long-term performance. As you might expect, performance starts off very poorly but improves quite rapidly during the early part of the season. It gets to average performance after about 4 weeks, but I typically start predicting after 2 weeks (800 games), when the error is still around 12 RMSE. The more interesting observation is that prediction accuracy gets steadily worse at the end of the season. Most of the games in those last three weeks of the season are tournament games: the various conference tournaments followed by the NCAA Tournament. I assume my predictor is just worse at tournament games.
It's also interesting to look at a different measure of performance: Wins Against the Spread (ATS). This is the percentage of games where the predictor would have placed a winning bet against the Las Vegas closing line.
 (Again, the red dotted line shows the average performance.) This shows a different shape than the RMSE plot. In the late part of the season, the predictor's performance ATS gets very good -- even though its RMSE performance is getting worse. There's a similar although less obvious trend in the early part of the season, too. (I'm not sure what's going on in Week 6.) Apparently my predictor performs poorly in the late season -- but the Vegas lines perform even worse.

It's also interesting to look at a different measure of performance: Wins Against the Spread (ATS). This is the percentage of games where the predictor would have placed a winning bet against the Las Vegas closing line.

Subscribe to:
Posts (Atom)